Diagrams
You can generate visual diagrams from any
StateChart — useful for documentation,
debugging, or sharing your machine’s structure with teammates.
Installation
Diagram generation requires pydot and Graphviz:
pip install python-statemachine[diagrams] # installs pydot
You also need the dot command-line tool from Graphviz. On Debian/Ubuntu:
sudo apt install graphviz
For other systems, see the Graphviz downloads page.
Generating diagrams
Every state machine instance exposes a _graph() method that returns a
pydot.Dot graph object:
from tests.examples.order_control_machine import OrderControl

sm = OrderControl()
graph = sm._graph()  # returns a pydot.Dot object
Highlighting the current state
The diagram automatically highlights the current state of the instance. Send events to advance the machine and see the active state change:
from tests.examples.traffic_light_machine import TrafficLightMachine

sm = TrafficLightMachine()
sm.send("cycle")
sm._graph().write_png("traffic_light_yellow.png")
Exporting to a file
The pydot.Dot object supports writing to many formats — use
write_png(), write_svg(), write_pdf(), etc.:
sm = OrderControl()
sm._graph().write_png("order_control.png")
For higher resolution PNGs, set the DPI before exporting:
graph = sm._graph()
graph.set_dpi(300).write_png("order_control_300dpi.png")
Note
Supported formats include dia, dot, fig, gif, jpg, pdf,
png, ps, svg, and many others. See
Graphviz output formats for the
complete list.
Text representations
State machines support multiple text-based output formats, all accessible
through Python’s built-in format() protocol, the formatter API, or
the command line.
Format |
Aliases |
Description |
Dependencies |
|---|---|---|---|
|
Mermaid stateDiagram-v2 source |
None [1] |
|
|
|
Transition table (pipe-delimited Markdown) |
None |
|
Transition table (RST grid table) |
None |
|
|
Graphviz DOT language source |
pydot |
|
|
SVG markup (generated via DOT) |
pydot, Graphviz |
Using format()
Use f-strings or the built-in format() function — no diagram imports needed:
>>> from tests.examples.traffic_light_machine import TrafficLightMachine
>>> sm = TrafficLightMachine()
>>> print(f"{sm:mermaid}")
stateDiagram-v2
    direction LR
    state "Green" as green
    state "Yellow" as yellow
    state "Red" as red
    [*] --> green
    green --> yellow : Cycle
    yellow --> red : Cycle
    red --> green : Cycle

    classDef active fill:#40E0D0,stroke:#333
    green:::active


>>> print(f"{sm:md}")
| State  | Event | Guard | Target |
| ------ | ----- | ----- | ------ |
| Green  | Cycle |       | Yellow |
| Yellow | Cycle |       | Red    |
| Red    | Cycle |       | Green  |
Works on classes too (no active-state highlighting):
>>> print(f"{TrafficLightMachine:mermaid}")
stateDiagram-v2
    direction LR
    state "Green" as green
    state "Yellow" as yellow
    state "Red" as red
    [*] --> green
    green --> yellow : Cycle
    yellow --> red : Cycle
    red --> green : Cycle
The dot format returns the Graphviz DOT language source:
>>> print(f"{sm:dot}")
digraph TrafficLightMachine {
...
}
An empty format spec (e.g., f"{sm:}") falls back to repr().
Using the formatter API
The formatter object is the programmatic entry point for rendering
state machines in any registered text format:
>>> from statemachine.contrib.diagram import formatter
>>> from tests.examples.traffic_light_machine import TrafficLightMachine

>>> print(formatter.render(TrafficLightMachine, "mermaid"))
stateDiagram-v2
    direction LR
    state "Green" as green
    state "Yellow" as yellow
    state "Red" as red
    [*] --> green
    green --> yellow : Cycle
    yellow --> red : Cycle
    red --> green : Cycle


>>> formatter.supported_formats()
['dot', 'markdown', 'md', 'mermaid', 'rst', 'svg']
Both format() and the Sphinx directive delegate to this same formatter
under the hood.
Registering custom formats
The formatter is extensible — register your own format with a
decorator and it becomes available everywhere (format(), CLI,
Sphinx directive):
from statemachine.contrib.diagram import formatter

@formatter.register_format("plantuml", "puml")
def _render_plantuml(machine_or_class):
    # your PlantUML renderer here
    ...
After registration, f"{sm:plantuml}" and --format plantuml work
immediately.
Command line
You can generate diagrams without writing Python code:
python -m statemachine.contrib.diagram <classpath> <output_file>
The output format is inferred from the file extension:
python -m statemachine.contrib.diagram tests.examples.traffic_light_machine.TrafficLightMachine diagram.png
To highlight the current state, use --events to instantiate the machine and
send events before rendering:
python -m statemachine.contrib.diagram tests.examples.traffic_light_machine.TrafficLightMachine diagram.png --events cycle cycle cycle
Use --format to produce a text format instead of a Graphviz image:
# Mermaid stateDiagram-v2
python -m statemachine.contrib.diagram tests.examples.traffic_light_machine.TrafficLightMachine output.mmd --format mermaid

# DOT source
python -m statemachine.contrib.diagram tests.examples.traffic_light_machine.TrafficLightMachine output.dot --format dot

# Markdown transition table
python -m statemachine.contrib.diagram tests.examples.traffic_light_machine.TrafficLightMachine output.md --format md

# RST transition table
python -m statemachine.contrib.diagram tests.examples.traffic_light_machine.TrafficLightMachine output.rst --format rst
Use - as the output file to write to stdout (handy for piping):
python -m statemachine.contrib.diagram tests.examples.traffic_light_machine.TrafficLightMachine - --format mermaid
Auto-expanding docstrings
Use {statechart:FORMAT} placeholders in your class docstring to embed
a live representation of the state machine. The placeholder is replaced
at class definition time, so the docstring always reflects the actual
states and transitions:
>>> from statemachine.statemachine import StateChart
>>> from statemachine.state import State

>>> class TrafficLight(StateChart):
...     """A traffic light.
...
...     {statechart:md}
...     """
...     green = State(initial=True)
...     yellow = State()
...     red = State()
...     cycle = green.to(yellow) | yellow.to(red) | red.to(green)

>>> print(TrafficLight.__doc__)
A traffic light.

| State  | Event | Guard | Target |
| ------ | ----- | ----- | ------ |
| Green  | Cycle |       | Yellow |
| Yellow | Cycle |       | Red    |
| Red    | Cycle |       | Green  |
Any registered format works: {statechart:rst}, {statechart:mermaid},
{statechart:dot}, etc.
Choosing the right format
Context |
Recommended format |
|---|---|
Sphinx with RST (autodoc default) |
|
Sphinx with MyST Markdown |
|
|
Either works; |
Sphinx autodoc integration
Since the placeholder is expanded at class definition time, Sphinx autodoc
sees the final rendered text — no extra configuration needed.
For example, this class uses {statechart:rst} in its docstring:
class SimpleSC(StateChart):
    """A simple three-state machine.

    {statechart:rst}
    """

    idle = State(initial=True)
    running = State()
    done = State(final=True)

    start = idle.to(running)
    finish = running.to(done)
And here is the rendered autodoc output:
- class tests.machines.showcase_simple.SimpleSC(model: TModel | None = None, state_field: str = 'state', start_value: Any = None, listeners: list[object] | None = None, **kwargs: Any)[source]
A simple three-state machine.
State
Event
Guard
Target
Idle
Start
Running
Running
Finish
Done
Sphinx directive
If you use Sphinx to build your documentation, the
statemachine-diagram directive renders diagrams inline — no need to generate
image files manually.
Setup
Add the extension to your conf.py:
extensions = [
    ...
    "statemachine.contrib.diagram.sphinx_ext",
]
Basic usage
Reference any importable StateChart class by
its fully qualified path:
```{statemachine-diagram} myproject.machines.OrderControl
```
Highlighting a specific state
Pass :events: to instantiate the machine and send events before rendering.
This highlights the current state after processing:
```{statemachine-diagram} myproject.machines.TrafficLight
:events: cycle
:caption: Traffic light after one cycle
```
Enabling zoom
For complex diagrams, add :target: (without a value) to make the diagram
clickable — it opens the full SVG in a new browser tab where users can
zoom and pan freely:
```{statemachine-diagram} myproject.machines.OrderControl
:target:
```
Mermaid format
Use :format: mermaid to render via
sphinxcontrib-mermaid
instead of Graphviz SVG — useful when you don’t want to install Graphviz
in your docs build environment:
```{statemachine-diagram} myproject.machines.TrafficLight
:format: mermaid
:caption: Rendered as Mermaid
```
        stateDiagram-v2
    direction LR
    state "Green" as green
    state "Yellow" as yellow
    state "Red" as red
    [*] --> green
    green --> yellow : Cycle
    yellow --> red : Cycle
    red --> green : Cycle
TrafficLightMachine (Mermaid)
Directive options
The directive supports the same layout options as the standard image and
figure directives, plus state-machine-specific ones.
State-machine options:
:events:(comma-separated string)Events to send in sequence. When present, the machine is instantiated and each event is sent before rendering.
:format:(string)Output format. Use
mermaidto render via sphinxcontrib-mermaid instead of Graphviz SVG. Default: DOT/SVG.
Image/figure options:
:caption:(string)Caption text; wraps the image in a
figurenode.:alt:(string)Alt text for the image. Defaults to the class name.
:width:(CSS length, e.g.400px,80%)Explicit width for the diagram.
:height:(CSS length)Explicit height for the diagram.
:scale:(integer percentage, e.g.50%)Uniform scaling relative to the intrinsic size.
:align:(left | center | right)Image alignment. Defaults to
center.:target:(URL or empty)Makes the diagram clickable. When set without a value, the raw SVG is saved as a file and linked so users can open it in a new tab for full-resolution zooming — useful for large or complex diagrams.
:class:(space-separated strings)Extra CSS classes for the wrapper element.
:figclass:(space-separated strings)Extra CSS classes for the
figureelement (only when:caption:is set).:name:(string)Reference target name for cross-referencing with
{ref}.
Note
The directive imports the state machine class at Sphinx parse time. Machines
defined inline in doctest blocks cannot be referenced — use the
_graph() method for those cases.
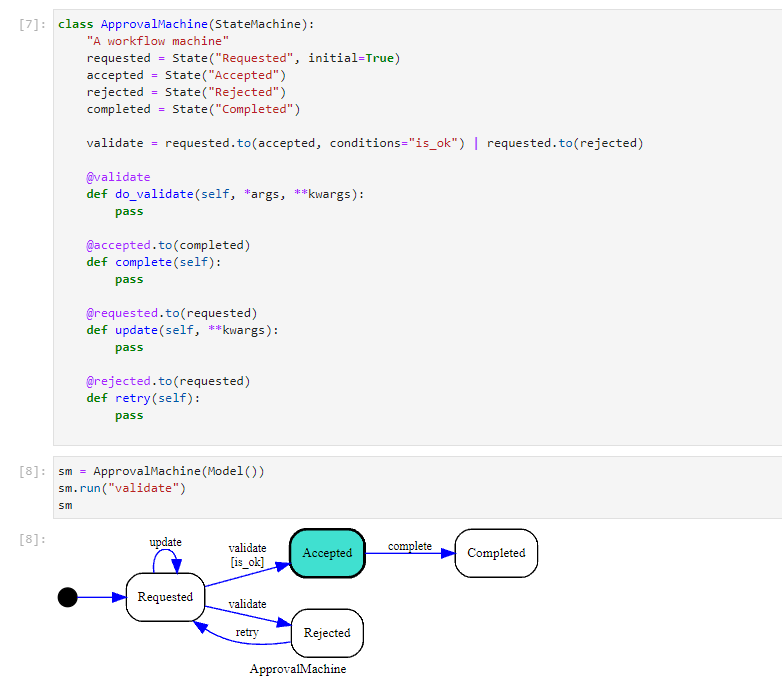
Jupyter integration
State machine instances are automatically rendered as diagrams in JupyterLab cells — no extra code needed:
Online generation (QuickChart)
If you prefer not to install Graphviz locally, you can generate diagrams using the QuickChart online service:
- statemachine.contrib.diagram.quickchart_write_svg(sm, path: str)[source]
If the default dependency of GraphViz installed locally doesn’t work for you. As an option, you can generate the image online from the output of the dot language, using one of the many services available.
To get the dot representation of your state machine is as easy as follows:
>>> from tests.examples.order_control_machine import OrderControl
>>> sm = OrderControl()
>>> print(sm._graph().to_string())
digraph OrderControl {
...
}
To give you an example, we included this method that will serialize the dot, request the graph to https://quickchart.io, and persist the result locally as an
.svgfile.Warning
Quickchart is an external graph service that supports many formats to generate diagrams.
By using this method, you should trust http://quickchart.io.
Please read https://quickchart.io/documentation/faq/ for more information.
>>> quickchart_write_svg(sm, "docs/images/oc_machine_processing.svg")
Customizing the output
The DotGraphMachine class gives you control over the diagram’s visual
properties. Subclass it and override the class attributes to customize
fonts, colors, and layout:
from statemachine.contrib.diagram import DotGraphMachine
from tests.examples.order_control_machine import OrderControl
Available attributes:
Attribute |
Default |
Description |
|---|---|---|
|
|
Graph direction ( |
|
|
Font face for labels |
|
|
State label font size |
|
|
Border width of the active state |
|
|
Fill color of the active state |
|
|
Transition label font size |
For example, to generate a top-to-bottom diagram with a custom active state color:
class CustomDiagram(DotGraphMachine):
    graph_rankdir = "TB"
    state_active_fillcolor = "lightyellow"

sm = OrderControl()
sm.receive_payment(10)

graph = CustomDiagram(sm)
dot = graph()
dot.write_svg("order_control_custom.svg")
DotGraphMachine also works with classes (not just instances) to
generate diagrams without an active state:
dot = DotGraphMachine(OrderControl)()
dot.write_png("order_control_class.png")
Visual showcase
This section shows how each state machine feature is rendered in diagrams. Each example includes the class definition, diagrams in both Graphviz and Mermaid formats, and instance diagrams with the current state highlighted after sending events.
Simple states
A minimal state machine with three atomic states and linear transitions.
class SimpleSC(StateChart):
    """A simple three-state machine.

    {statechart:rst}
    """

    idle = State(initial=True)
    running = State()
    done = State(final=True)

    start = idle.to(running)
    finish = running.to(done)
        stateDiagram-v2
    direction LR
    state "Idle" as idle
    state "Running" as running
    state "Done" as done
    [*] --> idle
    done --> [*]
    idle --> running : Start
    running --> done : Finish
Class (Mermaid)
Entry and exit actions
States can declare entry / exit callbacks, shown in the state label.
class ActionsSC(StateChart):
    off = State(initial=True)
    on = State()
    done = State(final=True)

    power_on = off.to(on)
    shutdown = on.to(done)

    def on_exit_off(self): ...
    def on_enter_on(self): ...
    def on_exit_on(self): ...
    def on_enter_done(self): ...
        stateDiagram-v2
    direction LR
    state "Off" as off
    off : exit / on_exit_off
    state "On" as on
    on : entry / on_enter_on
    on : exit / on_exit_on
    state "Done" as done
    done : entry / on_enter_done
    [*] --> off
    done --> [*]
    off --> on : Power on
    on --> done : Shutdown
Class (Mermaid)
Guard conditions
Transitions can have cond guards, shown in brackets on the edge label.
class GuardSC(StateChart):
    pending = State(initial=True)
    approved = State(final=True)
    rejected = State(final=True)

    def is_valid(self):
        return True

    def is_invalid(self):
        return False

    review = pending.to(approved, cond="is_valid") | pending.to(rejected, cond="is_invalid")
        stateDiagram-v2
    direction LR
    state "Pending" as pending
    state "Approved" as approved
    state "Rejected" as rejected
    [*] --> pending
    approved --> [*]
    rejected --> [*]
    pending --> approved : Review [is_valid]
    pending --> rejected : Review [is_invalid]
Class (Mermaid)
Self-transitions
A transition from a state back to itself.
class SelfTransitionSC(StateChart):
    counting = State(initial=True)
    done = State(final=True)

    increment = counting.to.itself()
    stop = counting.to(done)
        stateDiagram-v2
    direction LR
    state "Counting" as counting
    state "Done" as done
    [*] --> counting
    done --> [*]
    counting --> counting : Increment
    counting --> done : Stop
Class (Mermaid)
Internal transitions
Internal transitions execute actions without exiting/entering the state.
class InternalSC(StateChart):
    monitoring = State(initial=True)
    done = State(final=True)

    def log_status(self): ...

    check = monitoring.to.itself(internal=True, on="log_status")
    stop = monitoring.to(done)
        stateDiagram-v2
    direction LR
    state "Monitoring" as monitoring
    monitoring : check / log_status
    state "Done" as done
    [*] --> monitoring
    done --> [*]
    monitoring --> done : Stop
Class (Mermaid)
Compound states
A compound state contains child states. Entering the compound activates its initial child.
class CompoundSC(StateChart):
    class active(State.Compound, name="Active"):
        idle = State(initial=True)
        working = State()
        begin = idle.to(working)

    off = State(initial=True)
    done = State(final=True)

    turn_on = off.to(active)
    turn_off = active.to(done)
        stateDiagram-v2
    direction LR
    state "Active" as active {
        [*] --> idle
        state "Idle" as idle
        state "Working" as working
        idle --> working : Begin
    }
    state "Off" as off
    state "Done" as done
    [*] --> off
    done --> [*]
    active --> done : Turn off
    off --> active : Turn on
Class (Mermaid)
Parallel states
A parallel state activates all its regions simultaneously.
class ParallelSC(StateChart):
    class both(State.Parallel, name="Both"):
        class left(State.Compound, name="Left"):
            l1 = State(initial=True)
            l2 = State(final=True)
            go_l = l1.to(l2)

        class right(State.Compound, name="Right"):
            r1 = State(initial=True)
            r2 = State(final=True)
            go_r = r1.to(r2)

    start = State(initial=True)
    end = State(final=True)

    enter = start.to(both)
    done_state_both = both.to(end)
        stateDiagram-v2
    direction LR
    state "Both" as both {
        state "Left" as left {
            [*] --> l1
            state "L1" as l1
            state "L2" as l2
            l1 --> l2 : Go l
            l2 --> [*]
        }
        --
        state "Right" as right {
            [*] --> r1
            state "R1" as r1
            state "R2" as r2
            r1 --> r2 : Go r
            r2 --> [*]
        }
    }
    state "Start" as start
    state "End" as end
    [*] --> start
    end --> [*]
    both --> end : Done state both
    start --> both : Enter
Class (Mermaid)
Parallel with cross-boundary transitions
A transition targeting a compound state inside a parallel region triggers a
rendering bug in Mermaid (mermaid-js/mermaid#4052). The Mermaid renderer works
around this by redirecting the arrow to the compound’s initial child — compare the
rebuild arrow in both diagrams below.
class ParallelCompoundSC(StateChart):
    """Parallel regions with a cross-boundary transition into an inner compound.

    The ``rebuild`` transition targets ``pipeline.build`` — a compound state
    inside a parallel region.  This is the exact pattern that triggers
    `mermaid-js/mermaid#4052 <https://github.com/mermaid-js/mermaid/issues/4052>`_;
    the Mermaid renderer works around it by redirecting the arrow to the
    compound's initial child.

    {statechart:rst}
    """

    class pipeline(State.Parallel, name="Pipeline"):
        class build(State.Compound, name="Build"):
            compile = State(initial=True)
            link = State(final=True)
            do_build = compile.to(link)

        class test(State.Compound, name="Test"):
            unit = State(initial=True)
            e2e = State(final=True)
            do_test = unit.to(e2e)

    idle = State(initial=True)
    review = State()

    start = idle.to(pipeline)
    done_state_pipeline = pipeline.to(review)
    rebuild = review.to(pipeline.build)
    accept = review.to(idle)
        stateDiagram-v2
    direction LR
    state "Pipeline" as pipeline {
        state "Build" as build {
            [*] --> compile
            state "Compile" as compile
            state "Link" as link
            compile --> link : Do build
            link --> [*]
        }
        --
        state "Test" as test {
            [*] --> unit
            state "Unit" as unit
            state "E2e" as e2e
            unit --> e2e : Do test
            e2e --> [*]
        }
    }
    state "Idle" as idle
    state "Review" as review
    [*] --> idle
    pipeline --> review : Done state pipeline
    idle --> pipeline : Start
    review --> compile : Rebuild
    review --> idle : Accept
Class (Mermaid) — ``rebuild`` is redirected to Compile (initial child of Build)
History states (shallow)
A history pseudo-state remembers the last active child of a compound state.
class HistorySC(StateChart):
    class process(State.Compound, name="Process"):
        step1 = State(initial=True)
        step2 = State()
        advance = step1.to(step2)
        h = HistoryState()

    paused = State(initial=True)

    pause = process.to(paused)
    resume = paused.to(process.h)
    begin = paused.to(process)
        stateDiagram-v2
    direction LR
    state "Process" as process {
        [*] --> step1
        state "Step1" as step1
        state "Step2" as step2
        state "H" as h
        step1 --> step2 : Advance
    }
    state "Paused" as paused
    [*] --> paused
    process --> paused : Pause
    paused --> h : Resume
    paused --> process : Begin
Class (Mermaid)
Deep history
Deep history remembers the exact leaf state across nested compounds.
class DeepHistorySC(StateChart):
    class outer(State.Compound, name="Outer"):
        class inner(State.Compound, name="Inner"):
            a = State(initial=True)
            b = State()
            go = a.to(b)

        start = State(initial=True)
        enter_inner = start.to(inner)
        h = HistoryState(type="deep")

    away = State(initial=True)

    dive = away.to(outer)
    leave = outer.to(away)
    restore = away.to(outer.h)
        stateDiagram-v2
    direction LR
    state "Outer" as outer {
        [*] --> start
        state "Inner" as inner {
            [*] --> a
            state "A" as a
            state "B" as b
            a --> b : Go
        }
        state "Start" as start
        state "H*" as h
        start --> inner : Enter inner
    }
    state "Away" as away
    [*] --> away
    outer --> away : Leave
    away --> outer : Dive
    away --> h : Restore
Class (Mermaid)