Diagrams
You can generate diagrams from your StateMachine.
Note
This functionality depends on pydot, it means that you need to
have pydot installed on your system. pydot is a Python library that allows you to create and
manipulate graphs in Graphviz’s
dot language.
In order to use pydot, we also need to have Graphviz installed on your system.
You can install this library already with pydot dependency using the extras install option:
pip install python-statemachine[diagrams]
Or to install pydot manually, you can use pip by running the following command:
pip install pydot
To install Graphviz, you can visit the Graphviz website and follow the instructions for your operating system. Alternatively, you can use a package manager to install Graphviz. For example, on Debian-based systems (such as Ubuntu), you can use the following command:
sudo apt install graphviz
How to generate a diagram at runtime
>>> from statemachine.contrib.diagram import DotGraphMachine

>>> from tests.examples.order_control_machine import OrderControl

>>> graph = DotGraphMachine(OrderControl)  # also accepts instances

>>> dot = graph()

>>> dot.to_string()
'digraph list {...
With a dot graph instance, you can also generate images:
>>> dot.write_png("docs/images/order_control_machine_initial.png")
As this one:

The current State is also highlighted:
>>> from statemachine.contrib.diagram import DotGraphMachine

>>> from tests.examples.order_control_machine import OrderControl

>>> machine = OrderControl()

>>> graph = DotGraphMachine(machine)  # also accepts instances

>>> machine.receive_payment(10)
[10]

>>> graph().write_png("docs/images/order_control_machine_processing.png")

Hint
A handy shortcut to have the graph representation:
>>> machine._graph()
<pydot.core.Dot ...
Generate from the command line
You can also generate a diagram from the command line using the statemachine.contrib.diagram as a module.
❯ python -m statemachine.contrib.diagram --help
usage: diagram.py [OPTION] <classpath> <out>

Generate diagrams for StateMachine classes.

positional arguments:
  classpath   A fully-qualified dotted path to the StateMachine class.
  out         File to generate the image using extension as the output format.

optional arguments:
  -h, --help  show this help message and exit
Example:
python -m statemachine.contrib.diagram tests.examples.traffic_light_machine.TrafficLightMachine m.png
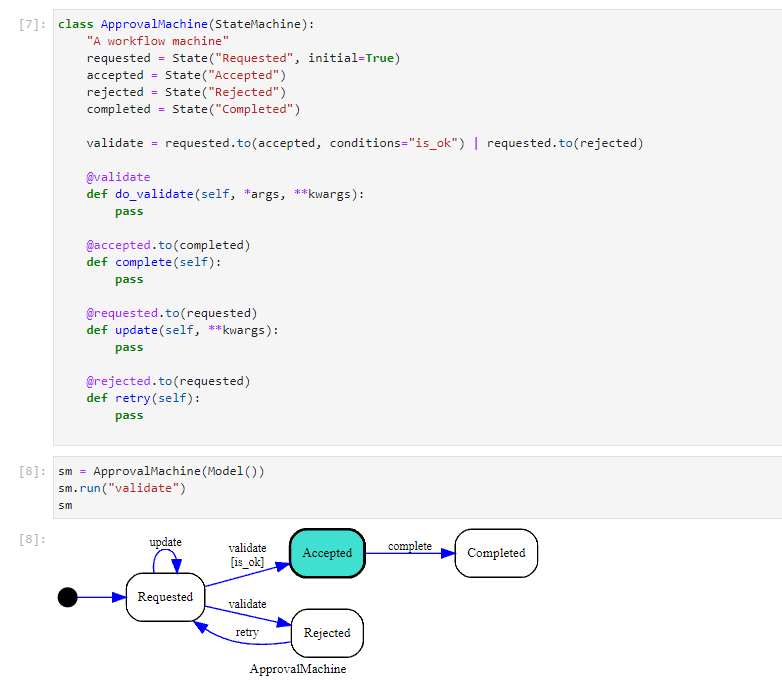
JupyterLab / Jupyter integration
Machines instances are automatically displayed as a diagram when used on JupyterLab cells:

Don’t want to install Graphviz
- statemachine.contrib.diagram.quickchart_write_svg(sm: StateMachine, path: str)[source]
If the default dependency of GraphViz installed locally doesn’t work for you. As an option, you can generate the image online from the output of the dot language, using one of the many services available.
To get the dot representation of your state machine is as easy as follows:
>>> from tests.examples.order_control_machine import OrderControl
>>> sm = OrderControl()
>>> print(sm._graph().to_string())
digraph list {
fontname=Arial;
fontsize="10pt";
label=OrderControl;
rankdir=LR;
...
To give you an example, we included this method that will serialize the dot, request the graph to https://quickchart.io, and persist the result locally as an
.svgfile.Warning
Quickchart is an external graph service that supports many formats to generate diagrams.
By using this method, you should trust http://quickchart.io.
Please read https://quickchart.io/documentation/faq/ for more information.
>>> quickchart_write_svg(sm, "docs/images/oc_machine_processing.svg")