Diagrams
You can generate visual diagrams from any
StateChart — useful for documentation,
debugging, or sharing your machine’s structure with teammates.
Installation
Diagram generation requires pydot and Graphviz:
pip install python-statemachine[diagrams] # installs pydot
You also need the dot command-line tool from Graphviz. On Debian/Ubuntu:
sudo apt install graphviz
For other systems, see the Graphviz downloads page.
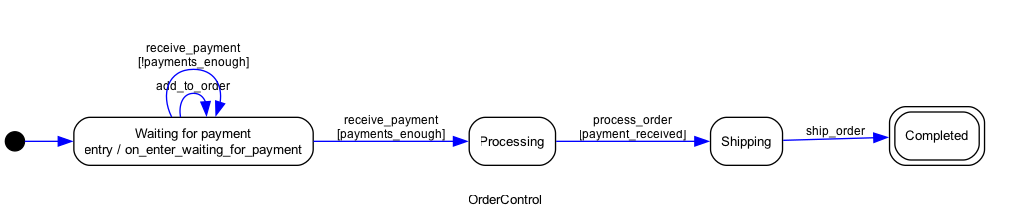
Generating diagrams
Use DotGraphMachine to create a diagram from a class or an instance:
>>> from statemachine.contrib.diagram import DotGraphMachine

>>> from tests.examples.order_control_machine import OrderControl

>>> graph = DotGraphMachine(OrderControl)  # also accepts instances

>>> dot = graph()

>>> dot.to_string()
'digraph OrderControl {...
Export to an image file:
>>> dot.write_png("docs/images/order_control_machine_initial.png")
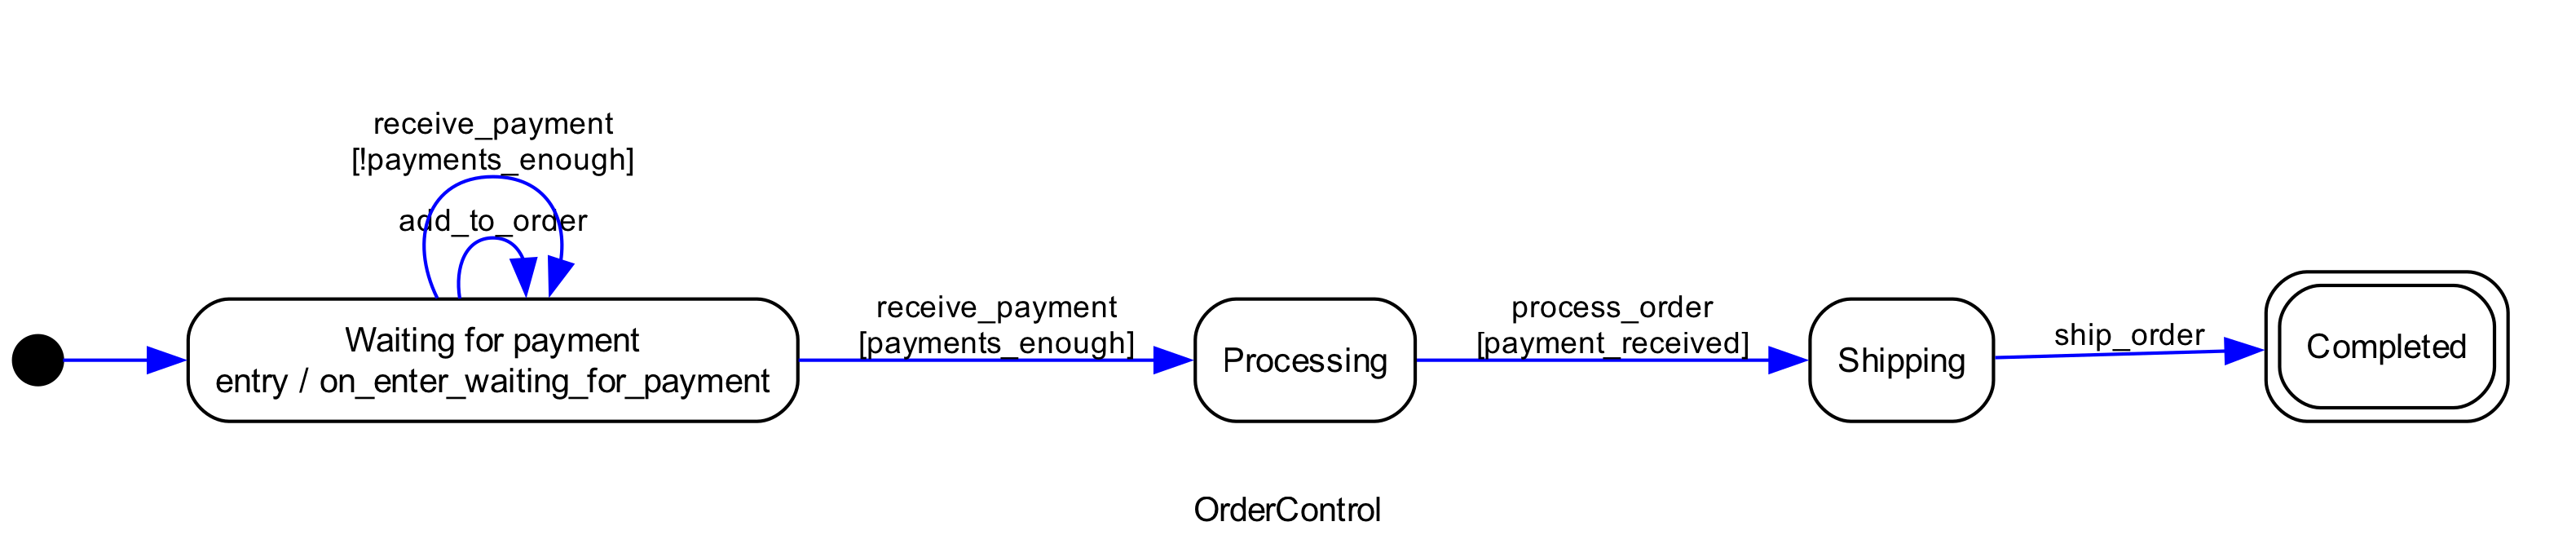
For higher resolution, set the DPI before exporting:
>>> dot.set_dpi(300)

>>> dot.write_png("docs/images/order_control_machine_initial_300dpi.png")
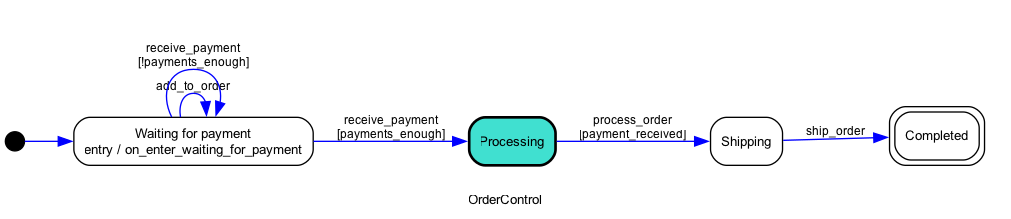
Highlighting the current state
When you pass a machine instance (not a class), the diagram highlights the current state:
>>> # This example will only run on automated tests if dot is present
>>> getfixture("requires_dot_installed")

>>> from statemachine.contrib.diagram import DotGraphMachine

>>> from tests.examples.order_control_machine import OrderControl

>>> machine = OrderControl()

>>> graph = DotGraphMachine(machine)  # also accepts instances

>>> machine.receive_payment(10)
[10]

>>> graph().write_png("docs/images/order_control_machine_processing.png")
Tip
Every state machine instance exposes a _graph() shortcut that returns
the pydot.Dot object directly.
>>> machine._graph()
<pydot.core.Dot ...
Command line
You can generate diagrams without writing Python code:
python -m statemachine.contrib.diagram <classpath> <output_file>
The output format is inferred from the file extension:
python -m statemachine.contrib.diagram tests.examples.traffic_light_machine.TrafficLightMachine diagram.png
Note
Supported formats include dia, dot, fig, gif, jpg, pdf,
png, ps, svg, and many others. See
Graphviz output formats for the
complete list.
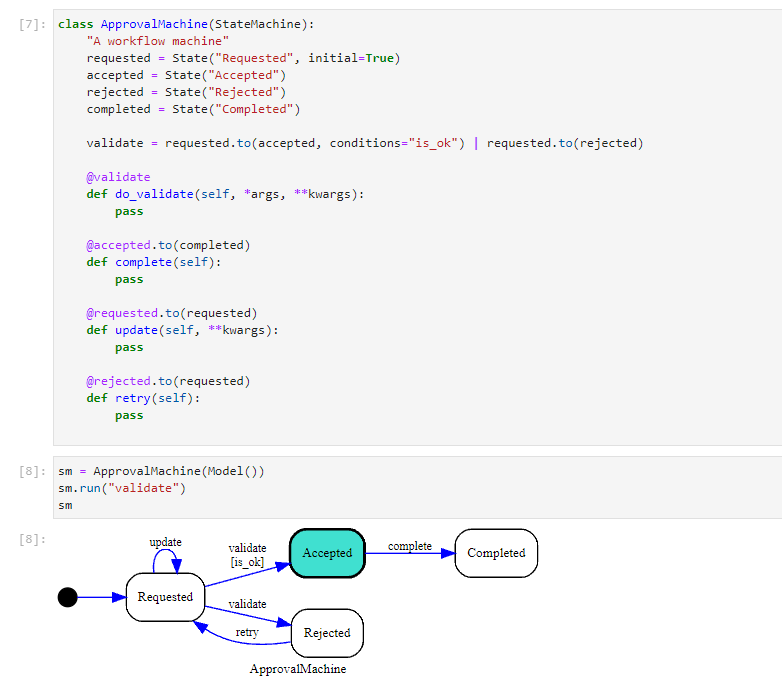
Jupyter integration
State machine instances are automatically rendered as diagrams in JupyterLab cells — no extra code needed:
Online generation (QuickChart)
If you prefer not to install Graphviz locally, you can generate diagrams using the QuickChart online service:
- statemachine.contrib.diagram.quickchart_write_svg(sm: StateChart, path: str)[source]
If the default dependency of GraphViz installed locally doesn’t work for you. As an option, you can generate the image online from the output of the dot language, using one of the many services available.
To get the dot representation of your state machine is as easy as follows:
>>> from tests.examples.order_control_machine import OrderControl
>>> sm = OrderControl()
>>> print(sm._graph().to_string())
digraph OrderControl {
compound=true;
fontname=Arial;
fontsize="10pt";
label=OrderControl;
rankdir=LR;
...
To give you an example, we included this method that will serialize the dot, request the graph to https://quickchart.io, and persist the result locally as an
.svgfile.Warning
Quickchart is an external graph service that supports many formats to generate diagrams.
By using this method, you should trust http://quickchart.io.
Please read https://quickchart.io/documentation/faq/ for more information.
>>> quickchart_write_svg(sm, "docs/images/oc_machine_processing.svg")
